
These days, the National Bureau of Statistics (NBS) does not inspire any confidence. In this essay, I talk about concerns on data from the NBS and what the NBS got wrong with the latest CPI rebasing exercise. Newsflash: it is bad!
There is an important build up to my review of the CPI rebasing so you have to be a bit patient.

In the third cohort of my macro class in late 2024, a curious participant asked if we should still trust the inflation data reported by the National Bureau of Statistics (NBS).
I told the class that concerns about the credibility of macro data is popular and not unique to Nigeria or the NBS. I have been using macro data in the finance industry in Nigeria since 2015 and concerns about the integrity of the NBS are pervasive.
Official data is always under scrutiny among the general public because people tend to project personal situations or anecdotes to macro data. For instance, the average person will say that unemployment numbers are wrong because “university graduates are driving trucks”. Even though their concerns about underemployment are valid, how do you explain to the person that truck driving is employment too?
In my experience, concerns about official data heighten in a crisis. When living or economic conditions worsen, people doubt macro data because it is not the best representation of their individual realities.
There is nothing wrong with disputing official data, but the best way to approach it is to do your due diligence.
More often than not, people have strong opinions that they have not interrogated and for which they cannot present a convincing case.
Beyond responding to that question orally, I wrote and shared a short essay with the class. I have attached a screenshot below.

It is important that we question data that we doubt as it is one of the ways to make public institutions accountable. This is an obligation for people who work with data. The other obligation is to put the data under scrutiny to investigate the issues.
Otherwise, it will be hard to make sense of official data. Which is real or fudged? Is it just inflation data? Or GDP data? Or household data? Or foreign investment data? Are they honest in some ways but dishonest in others?
Do we throw out everything or just a single one?
If you believe the NBS is fudging data, that is a point of no return because you are likely to doubt every official data they produce I going forward.
During the post COVID-19 inflation crisis that started in 2022, crypto adherents also doubted US inflation data. These people do not trust the government anyway, so that position is expected. But they did the work.
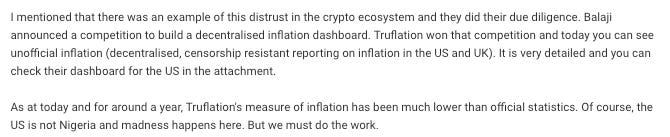
In my class, I talked about Truflation, a startup that emerged from a competition funded by Balaji Srinivasan to create “censorship-resistant” inflation data. If you are curious, you can read about the competition here.
This is a screenshot about the competition
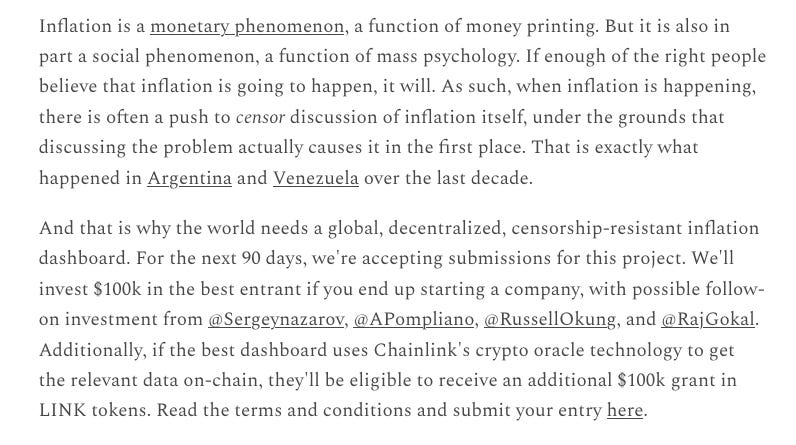
And this is why Balaji believes an alternative inflation dashboard should exist.

Truflation won that competition and created the dashboard, which is live today for the US, UK, Argentina and India.
What I have learned tracking the US data is that the official data reflect reality. Basically, they are close enough to debunk concerns about the quality of inflation data. For the US, you can see Truflation’s calculation is 1.42%, which is below the official data of 2.4%.

This is one of my favourite products of the past few years and it offers insights into how we can create alternative data in Nigeria.
If I had money to fund it, I’d build such a tool or fund people to build it. I invite people to fund or produce it. It has wide reaching applications beyond trying to hold the NBS accountable.
The NBS has Bungled its Recent Data Rebasing Exercise
If public confidence in NBS data was already low, its credibility of recent is at its worst in 15 years or since Yemi Kale (2011–2021 as Statistician General).
It is hard enough to produce data in an atmosphere of distrust, especially when the government of the day has weak legitimacy.
A big mistake the NBS has made is making wholesale changes to how data is collected, calculated and reported without carrying the public along.
Then I do not believe they’ve been thorough or completely honest, and the recent inflation data provides evidence that the NBS is playing games. But before we get into the inflation numbers, let’s talk about what came first.
Starting with the revamp of labour market data, it was always clear that the new NBS was not prepared.
The new leadership of the NBS failed its first test, which was a change in the methodology for its labour market data.
Nigerians woke up on 24th August 2023 to the news that unemployment dropped to 4.1% in Q1 2023 from 33.33% in Q4 2020 (the last time the data was officially available).
Obviously, everyone would question such a reveal.

I have no issue with revising Nigeria’s labour data. In fact, I like how rich the new metrics are. Before the revision, we did not have official data on the share of people in informal and wage employment, the nature of employment in farming, and so much more. Now we do, and they deserve some credit for that.
But when making updates to data, especially sensitive data such as unemployment, they need to pay just as much attention to producing the data as communicating the changes. While I do not think it would have made a difference with the general public, it would have been for the benefit of data consumers such as the media, businesses, analysts etc. who produce more accessible content for the consumption of the general public. They can help shape public perception.
The average person does not understand that the new data cannot be compared to the old data. The only thing that makes sense to them is the sharp drop from 33.3% to 4.1%, which is a gross misrepresentation of their reality.
Like Yemi Kale did in 2014, the NBS could have produced its new measures alongside the old way of calculating unemployment in a way that is clear to more people. At least, the media would have reported the numbers in a more nuanced way, framing the situation properly for the public.
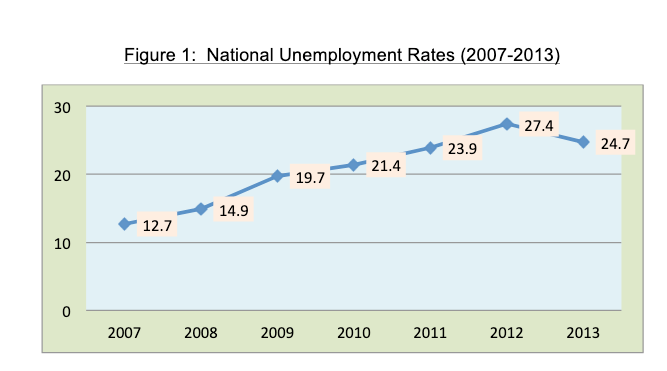
I am sure many people do not remember that the unemployment rate dropped sharply after the methodology changed in 2014. From a peak of 27.4% in 2010, unemployment dropped to 6.4% at the end of 2014.
However, the NBS reported both old and new throughout, as well as the ILO standard of unemployment, which is only what the NBS reports today. The decision to report both old and new provided reassurance that the NBS was not trying to misrepresent reality (at least for reasonable people). In as much as we want to align Nigeria’s data to global best practices, there is nothing wrong with reporting the “Nigerian Standard” during the transition process or even permanently like Yemi Kale did.

In the chart, you can see that three versions were reported. While the spike in unemployment rate in Nigeria was reasonable in 2020 due to COVID, a subsequent moderation as economies reopened was always going to be likely.
In the US, the chart below shows the spike and drop in unemployment post-covid.

Perhaps the most absurd thing the NBS did was a failure to report absolute numbers. In the old reports published until 2020 you can see the actual numbers of people in the labour force, numbers of employed, and so on. The new NBS labour data show only percentages and they have not reported absolute numbers till today.
Yet this is dangerous as things changed drastically during COVID. For instance, the number of employed people fell to 46.5 million from 69.5 million pre COVID, the number of people in the labour force dropped from 90.5 million to 69.7 million, and the number of people out of the labour force more than doubled to 52.3 million. This is terrible because it means 42.9% (from 21.7% prior to COVID) of Nigerians of working age were not working or looking for jobs. What were they doing?
If the NBS does not report absolute numbers, we would not be able to track progress because percentages will not show this. Percentages are relative numbers and there is an endless combination of numbers that will yield the same percentages (eg 1/2=10/20=30/60).

The rebased inflation data is even more worrying. Inflation suddenly dropped from 34.8% in December 2024 to 24.5% in January 2025 upon rebasing
There is no issue with rebasing the Consumer Price Index (CPI) or changing the methodology as many countries do it every five years. Things change over time (new products emerge, consumers’ spending pattern changes, etc) and these changes in the economy must be captured in the Consumer Price Index (CPI), which is an aggregate measure of consumer prices in the economy.
The four main things statistical agencies try to update include how consumer price data are collected, the products or categories, the weight of product categories, and the base year or period.
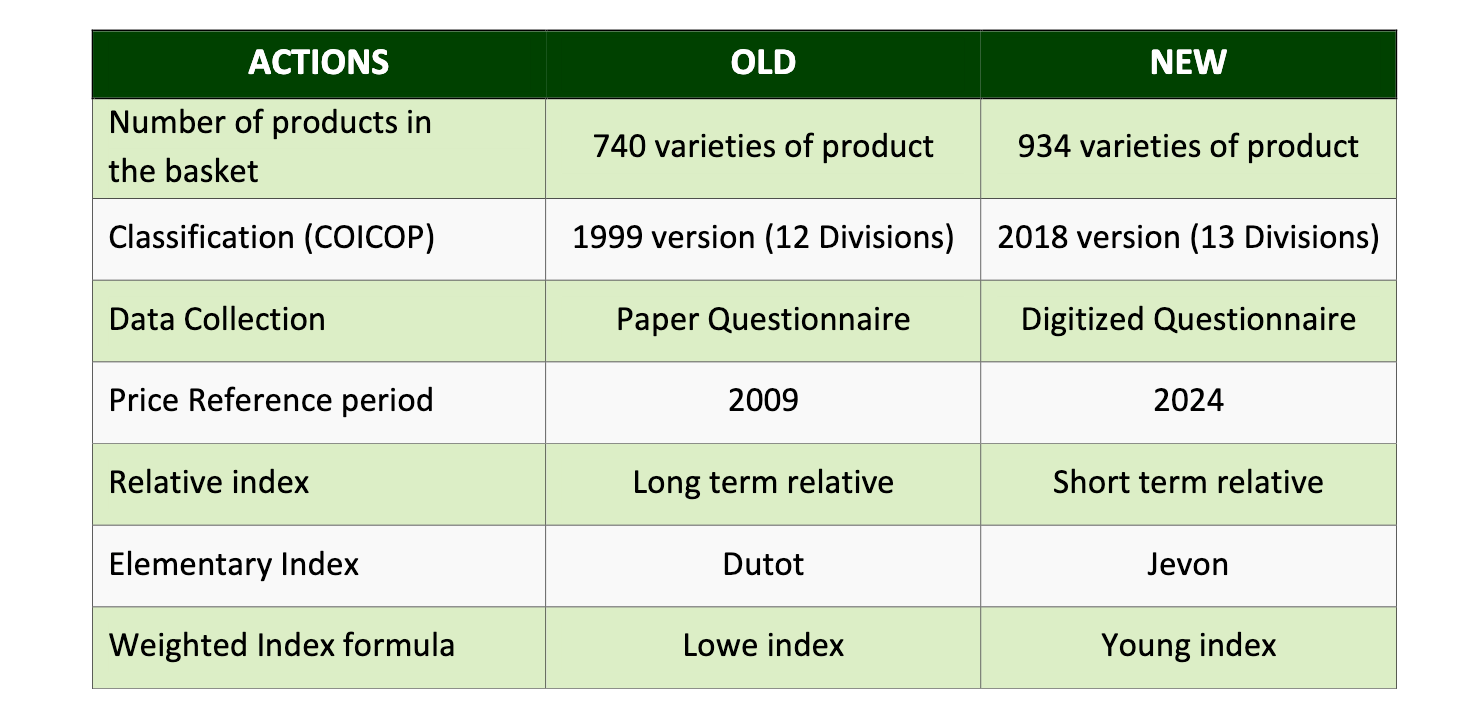
With the rebasing, 194 more products are captured in the CPI basket, and the product categories of the CPI have expanded to 13 divisions with the inclusion of insurance and financial services. Interestingly, the NBS did not provide any information on the kind of products and services that have been removed or added. This should be bare minimum.
The base period has been updated to 2024 from 2009. To explain this, think of the CPI as an index that compares prices at any period to what they were in 2024. Each CPI number reported, whether from 2020 or 2025, compares prices in those years to 2024 prices.
An example is in the table below using a single product. Let us calculate the CPI index for two base periods: 2021 and 2024. In constructing each CPI index, all prices of item A, regardless of the year, is compared to 2021 and 2024. The formula is Price in year 20xx/price in base year *100.

Those CPI numbers can then be used to calculate inflation. I have updated the table below. What do you notice? Simply changing the base year does not change inflation (the rate at which the price of the item is increasing). It only changes the index values as you can see that the CPI Index (2021=100) is different from CPI Index (2024=100).
Please do not forget this point, I will come back to it later.

Obviously the example above is a very simple view of constructing the CPI index because in reality many more products are considered. In that case, weights become important.
The most controversial change the NBS made was to the weights of the CPI categories. The weight of the different product categories of the CPI reflects how consumers spend. This makes sense because price changes in products that consumers spend more money on should matter more. These weights are typically sourced from a survey on consumer spending.
The weight on food and non-alcoholic beverages fell from 51.8% to 40.0%, while utilities (housing, water, electricity, gas etc) fell sharply from 16.7% to 8.4%. The weights of health, transportation, education and restaurant and accommodation services rose sharply.

When the news of the new weights were initially presented, people were rightly concerned about the lower weight of food & non-alcoholic beverage. The NBS explained that the exclusion of “meals away from home” is the reason for the lower weight of food and non-alcoholic beverage and the higher weight for restaurants and accommodation services. This makes sense and it shouldn’t matter as summing up both gives us roughly the same weight: 53.0% in 2009 vs 52.9% in 2024.

Overall, the NBS is suggesting that Nigerians reduced their share of spending on utilities and clothing & footwear, and started spending more on transportation, education and health, and information & communication. I am honestly surprised that utilities dropped that sharply. They mentioned that “inputted rent” was excluded from Utilities but I don’t think that is enough (in addition to student housing exclusion) to justify it. It is not good enough that the NBS did not provide a thorough explanation for these changes.
That said, the changes to the weights of the CPI should not cause such a sharp drop in inflation.
And here comes what is truly troubling…
The new CPI index numbers do not make sense in a way. Now please note that the CPI index is a representation of the price of all consumer goods and services covered.
Typically, the index value at the point of rebasing is always 100 if a single month or a single value is used like you saw in our example above.
However, the average of every month in 2024 (2024=100) is what the NBS used not a single month (November 2009=100) like they did during the previous rebasing. Now, it is not impossible that we can still have the CPI starting at 100 because some months can have the same prices as the average.
To help you understand this, here’s an example below. You can see that the CPI index value for July 2024 is 100 because it coincides with the average price for the year. When December 2024 is used as base period, the December CPI index value starts at 100. Basically, when a single month is used, the index will always start at 100. When the average for a year is used, it is possible for it not to start from 100.

Also, you can see that the monthly inflation is the same regardless of the base period. Please take note of this as we move on.

However, and somewhat unusual, after the NBS rebased, the CPI index values from June 2024 to November 2024 are higher than that of December 2024. This is not impossible, but it is highly unlikely in an environment of rising prices which we already know before rebasing.
Now recall that in earlier examples I said simply changing the base period does not change inflation.
The rebased index values seem to suggest that prices were higher from June — November 2024 than in December 2024. This makes no sense.

What this means is that prices reduced by 12.3% between November 2024 and December 2024. This is staggering and it has never happened before. From 1995 till 2024 the highest decline in the price index on a month on month basis was 3.5%.
Even worse, the rebased CPI data show that between December 2023 and December 2024, prices rose only by 15.44%. This does not make any sense. Based on data before the rebasing, inflation between both periods was 34.8%!
When statistical agencies make changes to the CPI, they try to reflect historical price changes. For instance, the year on year and month on month changes in the CPI up until December 2024 should be the same before and after the rebasing.
Pick any country in the world and that is what you will see. This is the US.

Now in Nigeria, why is there such a big difference with the latest NBS rebasing?
I analysed month on month changes in the CPI prior to the rebasing and after the rebasing. There was essentially no difference between both until December 2024, hence the sharp drop you can see in the graph below!
In fact, that’s the only time the blue line (rebased data) makes an appearance because the green line is evenly matched with it. Effectively, the underlying trend in prices was the same across all months.

What happened in December 2024? Why were prices much lower, and why did it coincide with the last month of the old CPI as if the month is the base period?
Similarly, why did prices rebound in January 2025 by 10.7%? This is also the highest on record on a month on month basis using old data from 1995. All the categories of the CPI show a similar pattern, so this cannot be traced to a shock in any category of prices.
In plain terms, the new NBS data seem to suggest that prices peaked in November 2024 and were yet to return to that level until March 2025. That is hard to believe and the old data, which is pretty consistent with the new data (until December 2024), suggest otherwise.
This is the only reason why inflation as reported in January, February and March 2025 is much lower than the 34.8% in December 2024 prior to rebasing.

For comparison, I did the same analysis for the past four inflation rebasing done by the NBS. Clearly, you can see that the lines for the four indices are evenly matched. There is no difference in inflation, and I have established that with numerous examples. This is why you can build inflation calculators dating back to any period because statistical agencies ensure continuity regardless of the base period.

Like I have explained in the previous examples, you can always reconstruct rebased data based on old data. So I reconstructed the new rebased data (2024=100) from the old data (November 2009=100).
Typically, the NBS rebases CPI based on a single month, 2024 was the only exception as the NBS used the monthly average. The first thing I noticed was that the NBS lied about using monthly average in 2024. Instead of using January to December 2024, they used December 2023 to November 2024. It’s still 12 months but there is no reason why they should not have made that clear.
The rebased data the NBS reported is in Col5. In Col3 you can see what should ideally be the index values the NBS should have reported based on monthly average in 2024. They are different and this threw me off, then I started experimenting with different monthly averages until I spotted the error.
In Col4 I used Dec 2023 to November 2024 average to rebase CPI and you can see that all months are the same with what the NBS reported with the exception of December 2024!
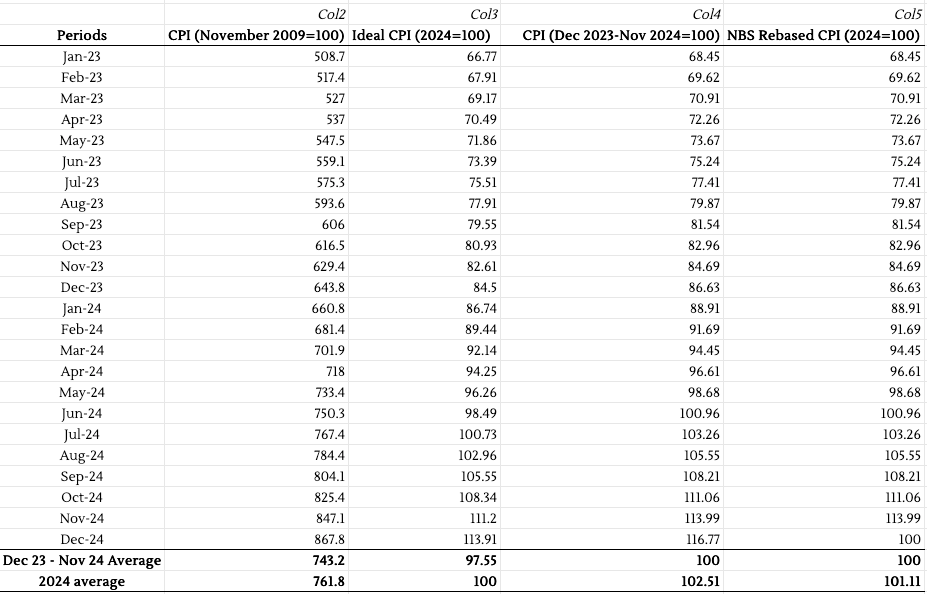
Again, what happened in December 2024? It seems the NBS just ignored what should have been the index value of 116.77 for December 2024 and just used an arbitrary 100 since the index should start at 100. But like I have explained in earlier examples, when you use the average for an entire year, the index does not have to start at 100. It is only the annual average of the index that will be 100. If you look at Dec 23-Nov 24 average in the table above, you’ll see that it’s 100 for both Col4 and Col5. Just by looking at the 2024 average of 101.11 in Col5, you can tell that the NBS did not use January to December 2024 as base period like they reported.
In my opinion, the 10.7% monthly inflation between December 2024 and January 2025 was necessary because there was no way inflation would not have dropped to low teens. In essence, I suspect the NBS made an error (or whatever they did) in December 2024 then “fudged” numbers for January 2025 to restore some sanity.
The February 2025 and March 2025 numbers show that monthly inflation remains within the 2%-3% range that we had throughout 2024 and inflationary pressures have not changed much.
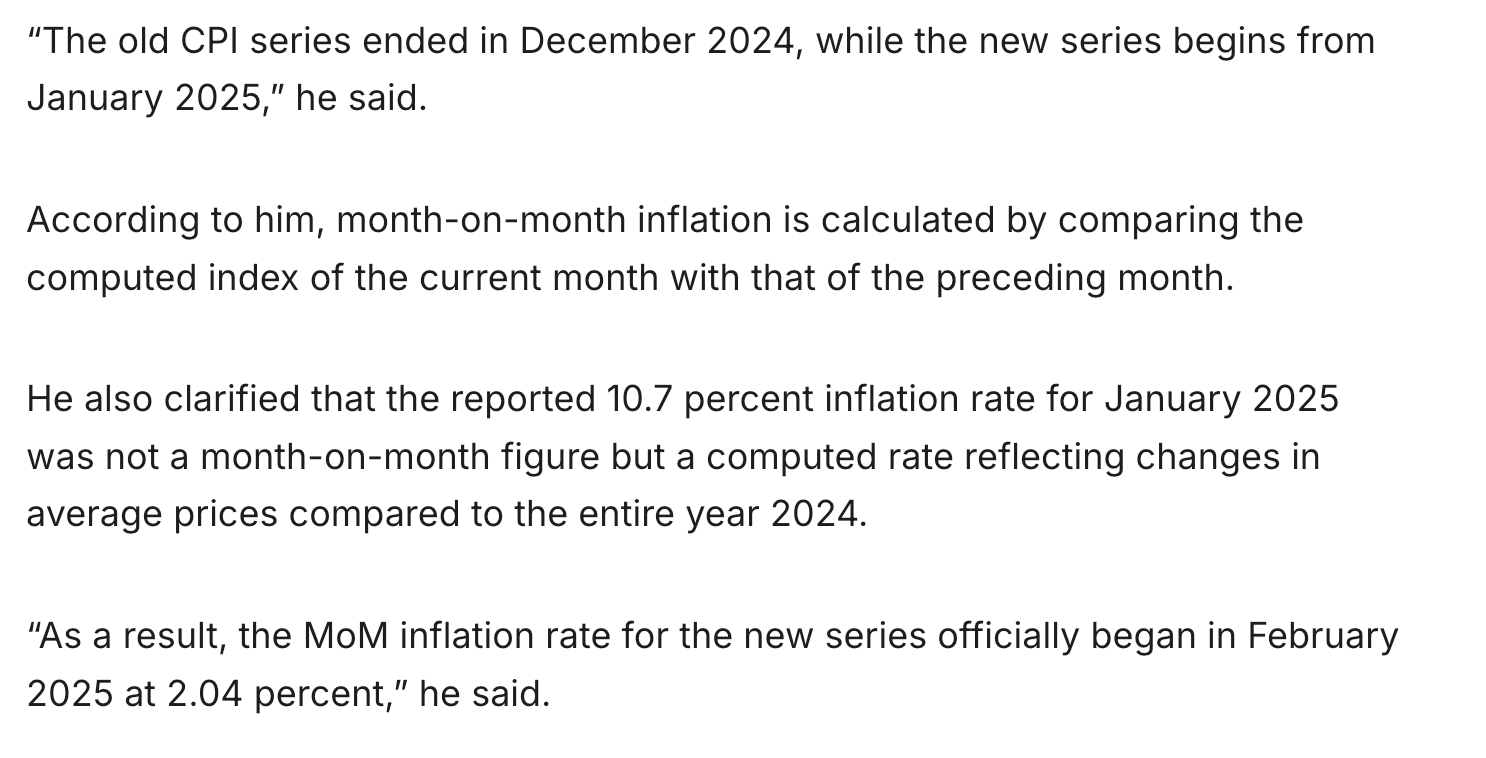
The explanations provided by Folorunso Alesanmi, the Acting Director of Communication and Public Relations at the NBS, do not make sense either. He claims that the 10.7% inflation between December 2024 and January 2025 should be ignored because it was based on average prices in 2024. Typically, every CPI index values compares prices to the base period. Both December 2024 and January 2025 CPI should be based on average prices in 2024. Unless they are saying they did not do that for December 2024 (which is what I have hinted at already).
I understand that they use short term relative in the computation of the index now, which means they compare prices in the current month to the previous month rather than the base period. However, even that makes no difference in this case because we are still in the short term as years have not gone by!
It is also hilarious that he claims that the “old CPI series ended in December 2024” but “MoM inflation rate for the new series officially began in February 2025”. No, it began in January 2025.
Did the NBS deliberately manipulate the rebasing of the data or is there a valid reason they are yet to share?
I am not a statistician but as a user of inflation data, what they have done does not make sense. Even worse, whatever the issue is, it will resurface in 2025 when the year on year inflation for December 2025 is calculated (due to the rapid decline in the index from November 2024 to December 2024 and the rapid growth in the index in January 2025).
To see what I mean, let us assume that prices by will continue to rise by 2.0% monthly for the rest of the year. Actually, it doesn’t matter what you assume, the trend will be similar. In the chart below, you can see the massive spike in inflation (from 20.6% to 40.2%) that will appear by December 2025, as well as the subsequent sharp decline in January 2026 (29.2%).
Look at the chart below, isn’t it one of the most absurd inflation charts you have seen?

Back to my initial questions…
“Is it just inflation data? Or GDP data? Or household data? Or foreign investment data? Are they honest in some ways but dishonest in others?
Which is real or fudged? Do we throw out everything or just a single one?”
Should the CBN rely on this data for monetary policy…
The CBN seems to not have a problem with the outcome of the rebasing based on the summary of the last Monetary Policy Committee meeting. It is fair to say that it will serve as the basis for conducting monetary policy going forward and this is problematic.
When inflation is low, there is a good justification for interest rates to be low. This is already evident in the money market where treasury bills that used to provide returns around 25% now provide returns less than 20%.
But inflationary pressures have not eased and the headline inflation is wrong because of the way the CPI was rebased.
Savers and investors are not idiots because if interest rates are lower than they should normally be or do not compensate for inflation they would not hold the naira over time.
The NBS needs to clarify what they have done and make their calculations and data public. Statistical agencies in other countries do this, so it is not something new. In fact, it will help in building trust with the public. More importantly, the NBS should release both the old series (november 2009=100) the new series (2024=100) and how they linked both to arrive at the numbers published. Other countries do this.
They require the data to appear in a particular manner to justify additional loans from multilateral organizations such as the IMF and the World Bank, which must demonstrate that their reform programs are yielding results. Yemi Kale left because of this.